See What Food Really Costs
Last updated
Most people know roughly what they spend on groceries. Almost nobody knows how much of it ends up in the trash. Tuna shows both, side by side, from the receipts you already scan: what you spent, what you tossed, and which foods keep going bad before anyone eats them.
Open Grocery spending
- Open the Receipts tab.
- Tap the chart in the top corner.
- Pick Month, Year or All time, and step back through earlier periods with the arrows.
At the top, Spent and Tossed sit next to each other. Spent is what your receipts added up to. Tossed is what you paid for food from those receipts that went in the trash, counted on the day it was tossed. Tossed is money you could have kept by not buying it, or by using it before it went bad.
What became of your groceries
The chart follows the food you bought, by shopping date, to where it ended up:
- Used: eaten, or cooked into something that got eaten.
- Tossed: pitched, marked All gone as tossed, or recorded as waste.
- Still in the house: not used up yet.
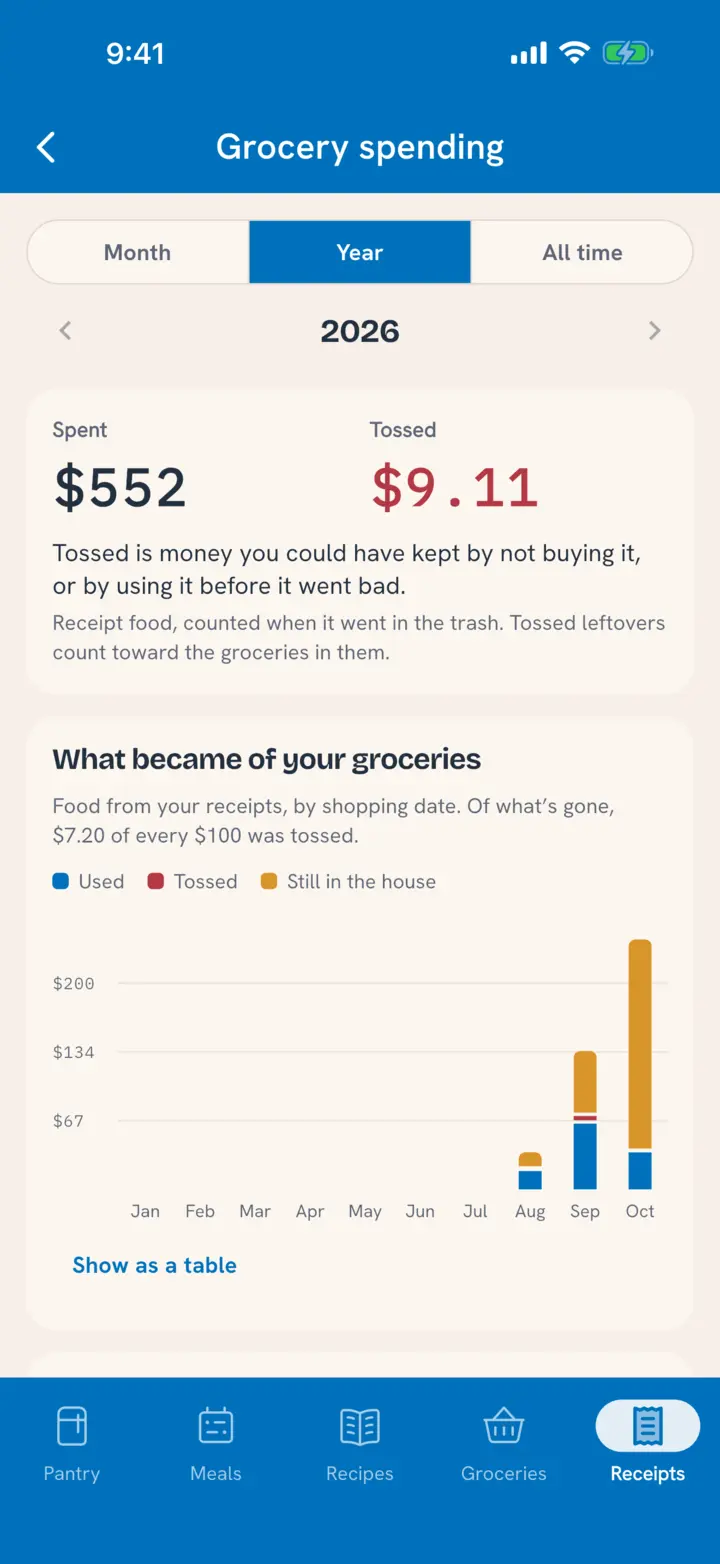
Year stacks the months side by side, and Show as a table gives the numbers behind them. Month and All time show one bar for each. A line under the chart puts the tossed share in plain terms: of what's gone, how many dollars of every $100 were tossed.
What you toss most
A ranked list of the foods you throw out, with a switch:
- Dollars ranks by what the tossed food cost.
- Tosses ranks by how often it happens. One Pitch, one All gone marked tossed, or one waste entry is one toss.
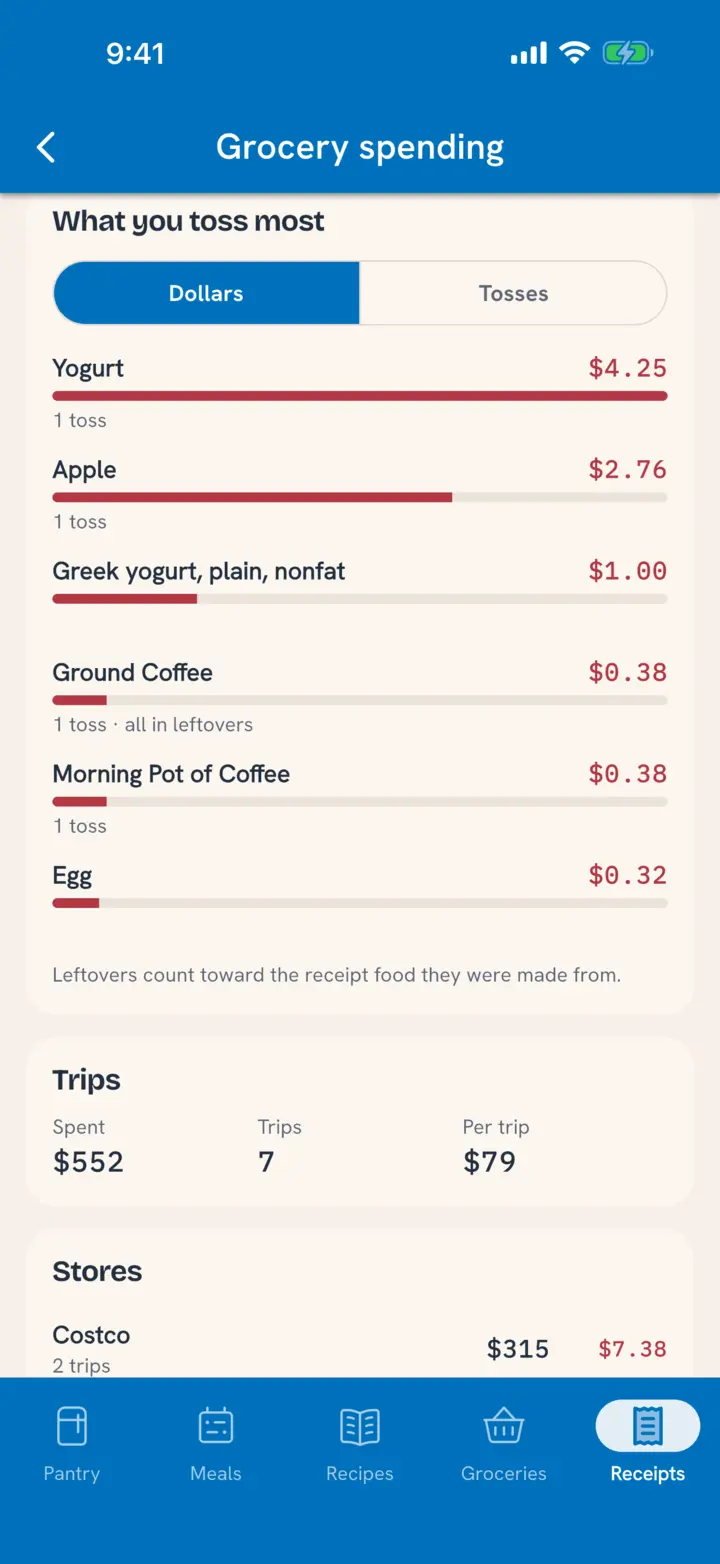
Each row shows the other measure too, and how much of it was in leftovers. Repeat offenders are the easiest savings to find: buy the smaller bag of spinach, or plan it into a meal the day you bring it home.
Trips and stores
Below the list:
- Trips shows how many shops, the average per trip, and how that compares with the period before.
- Stores lists where you shop, with what you spent and what you tossed at each.
Budget and cost per meal
For the whole money picture, open Insights from the menu and tap Spending.
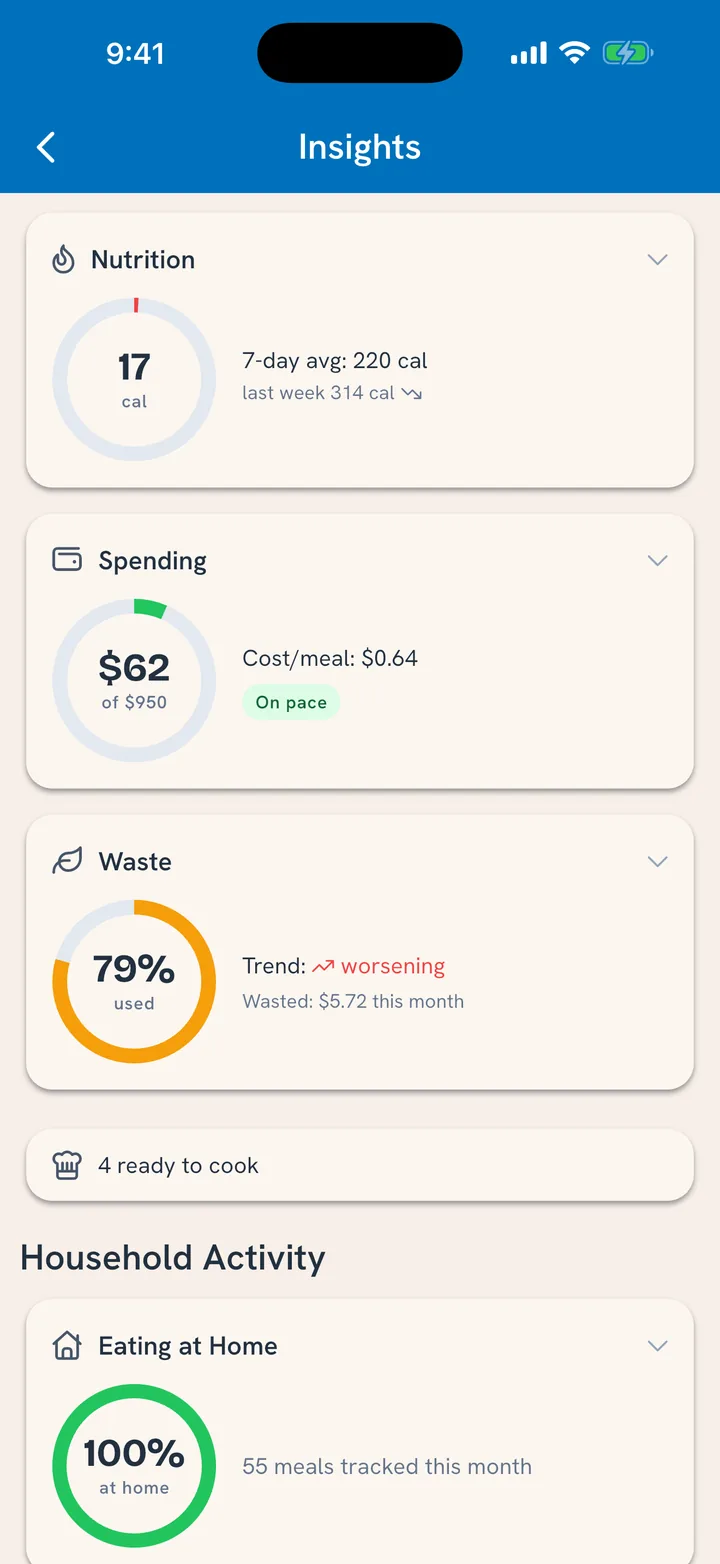
- Monthly budget: one number for all food, groceries and eating out together, with whether this month is on pace. See Set a Food Budget.
- Cost per meal: what a meal costs you, from the prices on your receipts. Ingredients you haven't scanned a receipt for yet use estimates until you do.
- Home vs eating out: the last 30 days of meals on each side, and what each costs.
Reading it without obsessing
The page rewards a monthly glance, not a daily vigil:
- Watch Tossed as well as Spent. The total you spend is mostly fixed by your household. The tossed part is the part you can change.
- Look at the top of What you toss most. One or two foods usually make up most of it.
- Scan every receipt. The page counts receipt food, so a shop you didn't scan is a shop it can't see.
The goal isn't to spend as little as possible. It's to stop paying for food nobody eats.
Related
- Where the numbers come from: Add Each Shop From the Receipt.
- Saying where food went: Mark Food All Gone.
- One number for the month: Set a Food Budget.